MACD (Moving Average Convergence Divergence)
- Introduction
MACD uses two exponential moving averages (fast and slow) to calculate the difference (DIF). It then uses the average of the difference (DEM) to identify signals of convergence (merging) and divergence (separating), thereby determining the timing for buying and selling stocks.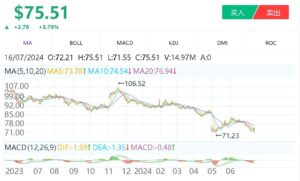
- Calculation Formula
- Average Index (DI) = (Highest Price + Lowest Price + 2 * Closing Price) / 4
- Exponential Moving Average (EMA) = Previous EMA + 2 / (1 + Number of Moving Average Days) * (Current Average Index - Previous EMA)
- Difference (DIF) = 12-day EMA - 26-day EMA
- MACD = Previous MACD + 2 / (1 + Number of Moving Average Days) * (DIF - Previous MACD)
- Application
- When both MACD and DIF are positive, it can be considered a bull market.
- When both MACD and DIF are negative, it can be considered a bear market.
- When DIF breaks above MACD, it is a buy signal.
- When DIF breaks below MACD, it is a sell signal.
- When DIF turns from negative to positive and crosses MACD, it is a buy signal.
- When DIF turns from positive to negative and breaks MACD, it is a sell signal.
- If both MACD and DIF are positive, and DIF breaks above MACD, it is a buyer's market, favoring long positions.
- If both MACD and DIF are negative, and DIF breaks below MACD, it is a seller's market, favoring short positions.
- When DIF diverges from the market index, if the stock price continues to hit new lows, but DIF does not, it is a positive divergence and a buy signal. Conversely, if the stock price continues to hit new highs but DIF does not, it is a negative divergence and a sell signal.
- Features
- MACD can better capture significant rising waves; after a big drop, finding a buying point should prioritize MACD. It is a good analysis tool for determining the main trend in the stock market.
- MACD has a unique analysis ability for medium to long-term investment and is quite accurate in confirming large amplitude trends. The cyclical nature of MACD helps wave theory researchers confirm the amplitude of trends.
- MACD can reduce 52% of false breakouts in moving averages, reducing ineffective trades and improving profitability.
- After a significant rise, MACD and DIF often "tangle," making buy signals less reliable and unsuitable for use.
KDJ (Stochastic Oscillator)
- Introduction
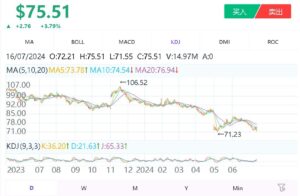
The stochastic oscillator, initially used for futures market analysis, is now widely used for short to medium-term trend analysis in the stock market. It calculates the unrefined stochastic value (RSV) of the last calculation period based on the highest price, lowest price, and closing price over a specific period (often 9 days or weeks). Using the smoothed moving average method, it calculates the K, D, and J values and draws a curve to analyze the stock trend.
- Calculation Formula
1. The KDJ indicator calculates the overbought and oversold conditions over a specific period (n days or weeks).
2. First, calculate the RSV value, then the K, D, and J values.
3. Generally, n is taken as 9 days.
4. RSV (n days) = (Cn - Ln) / (Hn - Ln) * 100
5. Cn: Closing price on the nth day
6. Ln: Lowest price in n days
7. Hn: Highest price in n days
8. Next, calculate the K and D values: K = 2/3 * Previous Day's K + 1/3 * Current RSV D = 2/3 * Previous Day's D + 1/3 * Current K J = 3 * Current K - 2 * Current D - Application
1. The K line is the fast confirmation line - values above 90 are overbought, values below 10 are oversold.
2. The D line is the slow main line - values above 80 are overbought, values below 20 are oversold.
3. The J line is the direction-sensitive line. When the J value is above 90, especially for more than 5 days, the stock price will at least form a short-term top. Conversely, when the J value is below 10, especially for several days, the stock price will at least form a short-term bottom.
4. When the K value gradually exceeds the D value, shown by the K line crossing above the D line on the chart, it is called a golden cross, indicating a buy signal.
5. In practice, when the K and D lines cross below 20, the short-term buy signal is more accurate. If the K value is below 50 and crosses the D value twice from below, forming a "W bottom" shape with the right bottom higher than the left, the stock price is likely to have a considerable rise.
6. When the K value gradually falls below the D value, shown by the K line crossing below the D line on the chart, it is called a death cross, indicating a sell signal.
7. In practice, when the K and D lines cross above 80, the short-term sell signal is more accurate. If the K value is above 50 and crosses the D value twice from above, forming an "M top" shape with the right top lower than the left, the stock price is likely to have a considerable drop.
8. Analyzing the divergence between KDJ and stock prices to determine tops and bottoms is also a practical method:
9. When the stock price hits new highs, but the KD value does not, it is a negative divergence and a sell signal.
10. When the stock price hits new lows, but the KD value does not, it is a positive divergence and a buy signal.
11. When the stock price does not hit new highs, but the KD value does, it is a negative divergence and a sell signal.
12.When the stock price does not hit new lows, but the KD value does, it is a positive divergence and a buy signal. 13. Note that the KDJ divergence method should only compare with the KD value of the previous high or low point, not skipping points. - Features
1. The KD line combines momentum concepts, relative strength index (RSI), and moving averages, making it suitable for medium and short-term operations.
2.The D value is derived from the K value, making it smoother.
3. Short-term overbought or oversold signals are more accurate than RSI, providing clear buy and sell points.
4. It can analyze stock or market trends from its fluctuations, making it a highly referential technical indicator.
5.The indicator is less applicable to stocks with low trading volumes but more accurate for popular stocks.
BOLL (Bollinger Bands)
- Introduction
Bollinger Bands calculate the "standard deviation" of stock prices and then determine the "confidence interval" of stock prices. The indicator draws three lines on the chart, with the upper and lower lines acting as resistance and support lines, and a middle line representing the average stock price. The stock price fluctuates within the upper and lower bands, and the width of this band varies with the stock price volatility. Bollinger Bands usually use a 20-day parameter.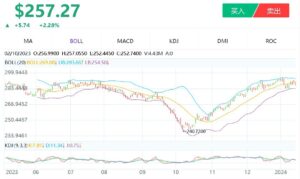
- Calculation Formula
- Middle Band = N-day Moving Average
- Upper Band = Middle Band + 2 * Standard Deviation
- Lower Band = Middle Band - 2 * Standard Deviation
- Application
- When the stock price crosses the upper resistance line, it is a sell signal.
- When the stock price crosses the lower support line, it is a buy signal.
- When the stock price crosses the middle line from below, it is a signal to add positions and is considered a potential bullish signal.
- When the stock price crosses the middle line from above, it is a sell signal and is considered a potential bearish signal.
- Features
- When the stock price breaks through the upper band with volume and the TRIX indicator has already issued a low "golden cross," it indicates that the stock price is about to enter a medium to long-term upward channel, a buy signal from the BOLL indicator. Investors should buy stocks promptly.
- After the Bollinger Bands have been moving narrowly at the bottom for a long time, if the stock price breaks through the upper band with volume and the narrow Bollinger Band channel suddenly opens upward, it indicates that the stock price is about to leave the original horizontal channel and enter a new upward channel, a buy signal from the BOLL indicator.
- When the stock price breaks through the middle band downward, and the TRIX indicator has issued a high "death cross," it indicates that the stock price is about to enter a medium to long-term downward channel, a sell signal from the BOLL indicator. Investors should sell their holdings promptly.
- After the Bollinger Bands have been moving narrowly at the top for a long time, if the stock price breaks through the lower band downward and the narrow Bollinger Band channel suddenly opens downward, it indicates that the stock price is about to leave the original horizontal channel and enter a new downward channel, a sell signal from the BOLL indicator.